JOIN OUR WHATSAPP GROUP. CLICK HERE
The Importance of a Weather Chart for Grade R Learners and How to Use It
The Importance of a Weather Chart for Grade R Learners and How to Use It How to Use a Weather Chart and Its Importance for Grade R Learners: For young learners in Grade R, understanding about the weather is an essential component of their early educational journey. It goes beyond simply knowing whether it’s sunny or raining outside. The foundation for understanding more advanced environmental and scientific ideas is laid by this information. Using a weather chart is one of the best ways to present weather topics to Grade R students. This application offers a concrete and engaging way to view and talk about the constantly shifting weather patterns around the world.
Importance of a Weather Chart for Grade R Learners
- Introducing Scientific Concepts: Weather charts act as an initial platform for introducing young learners to basic scientific concepts. These charts help students understand patterns, changes, and cycles in the weather, thereby nurturing their scientific curiosity.
- Developing Observational Skills: Through regular use of a weather chart, children enhance their observational skills. They learn to notice subtle changes in their environment, such as the shift from sunny to cloudy weather or the change in temperature from morning to night.
- Fostering Critical Thinking: When children observe and record weather patterns over time, they begin to identify patterns and predict future weather. This fosters early critical thinking and reasoning skills.
- Enhancing Numeracy and Literacy Skills: A weather chart can also be used to develop basic numeracy and literacy skills. As children associate symbols and images on the chart with words and numbers, they are subtly improving their reading and counting abilities.
How to Use a Weather Chart in Grade R
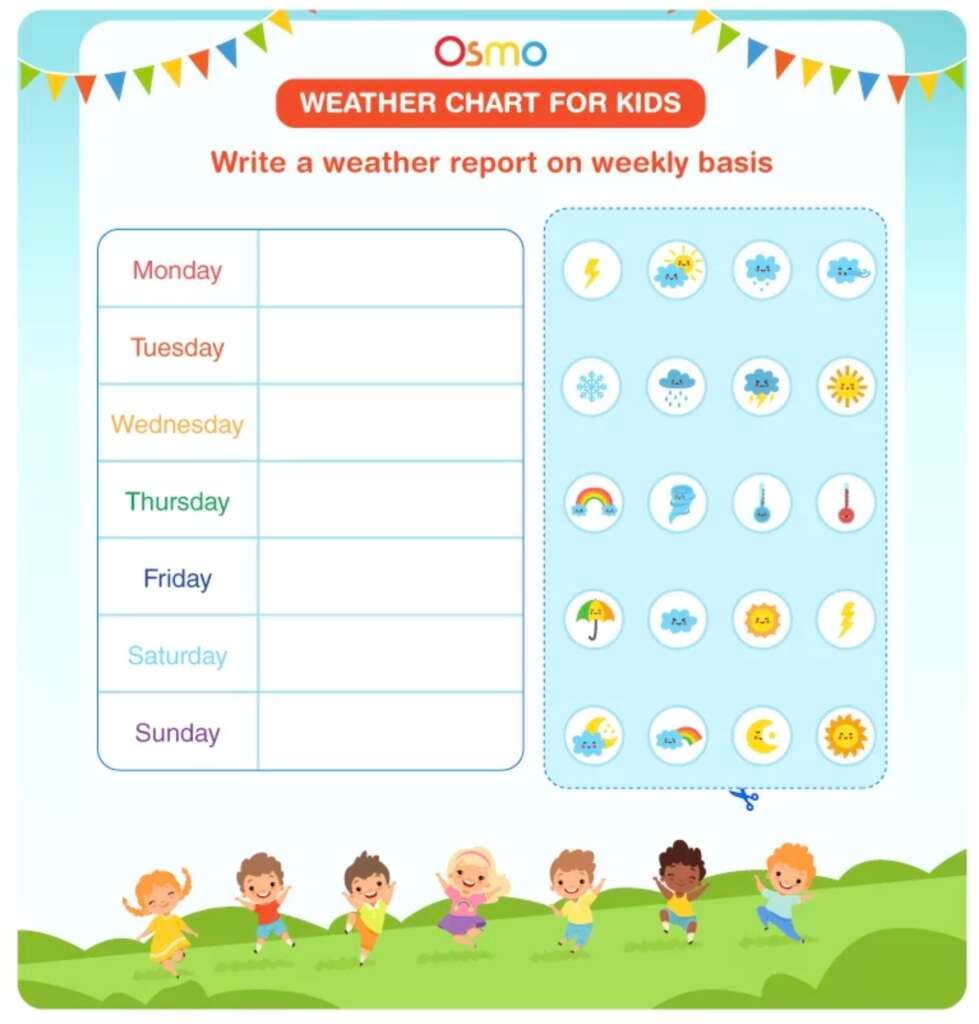
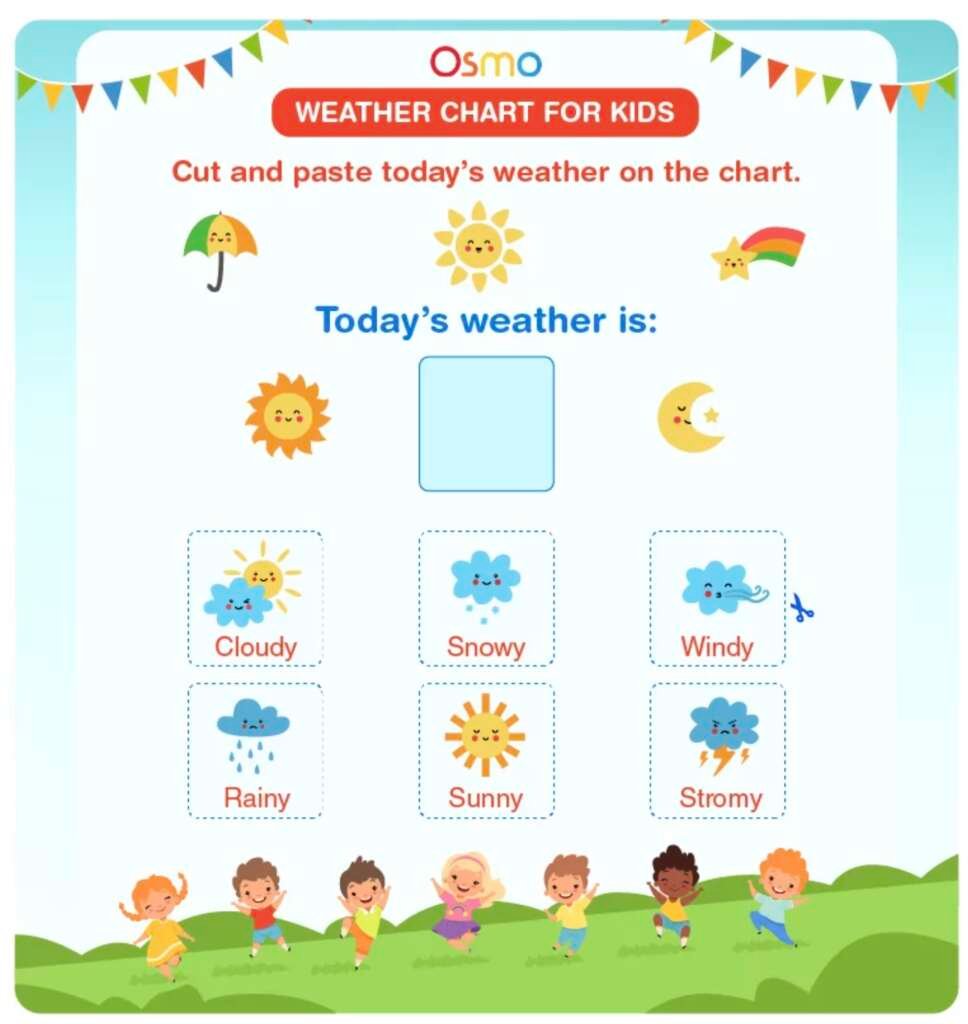
- Selection of the Chart: Choose a chart that is visually appealing and age-appropriate. It should include symbols for various weather types like sunny, cloudy, rainy, windy, snowy, etc. Also, make sure it includes a section for recording the daily temperature.
- Daily Observations: Encourage students to observe the weather daily and record their observations on the chart. You could make this a regular part of your morning routine, thus encouraging the development of observation and recording skills.
- Discuss Findings: After recording the day’s weather, engage the children in a discussion about their findings. Ask questions like “How is the weather today different from yesterday?” or “What do you think the weather will be like tomorrow?” to stimulate critical thinking.
- Comparing and Predicting: After a few weeks of daily observation and recording, use the chart to discuss patterns and changes over time. Encourage children to make predictions based on these patterns.
- Integrating with Other Subjects: Use the weather chart as a springboard for integrating other subjects. For instance, you could link it to literacy by encouraging children to write stories or poems about the weather, or to mathematics by getting them to count the number of sunny or rainy days in a month.
Weather chart for grade r free download
Daily Weather Chart for Grade R:


A weather chart is an invaluable tool in a Grade R classroom. It not only introduces children to scientific concepts but also enhances various cognitive skills. By integrating it into daily routines and other subjects, educators can make learning about weather an engaging and multidimensional experience for young learners.
JOIN OUR TELEGRAM CHANNEL. CLICK HERE

Be the first to comment