JOIN OUR WHATSAPP GROUP. CLICK HERE
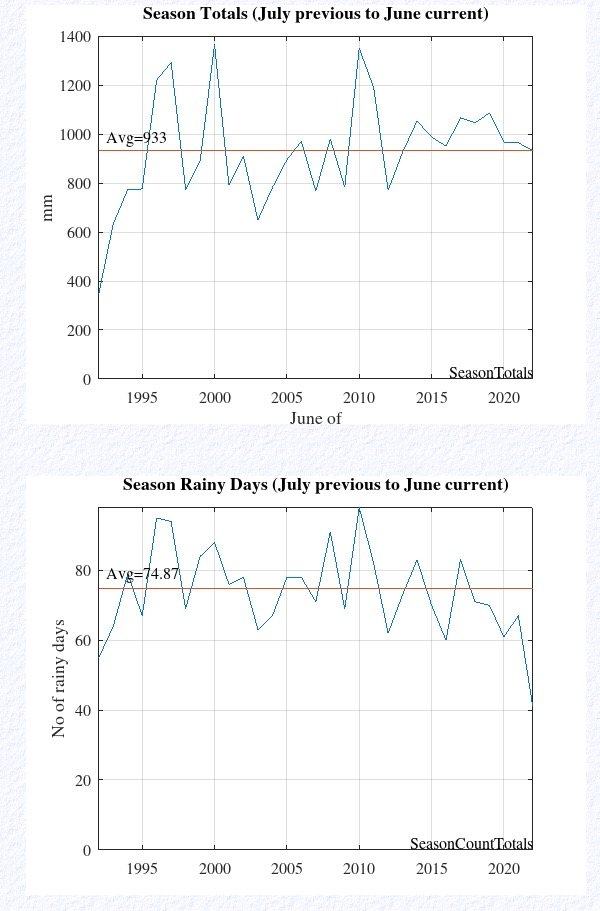
Annual rainfall graphs of the past five years in South Africa
Annual rainfall graphs of the past five years in South Africa The first graphs show the annual rainfall in millimeters from 1995 to 2020. The second map depicts the number of rainy days in each year between 1995 and 2020.
Annual rainfall graphs 1995 -2020: South Africa

JOIN OUR TELEGRAM CHANNEL. CLICK HERE

Be the first to comment